At work we are running several ASP.NET Core APIs on the hosted version of Kubernetes in the Google Cloud (GCE—Google Container Engine). In almost all of our components we noticed that they had unreasonably high memory usage. The resource limit for memory was set to 500MB, and still, many of our—relatively small—APIs were constantly being restarted by Kubernetes due to exceeding the memory limit.
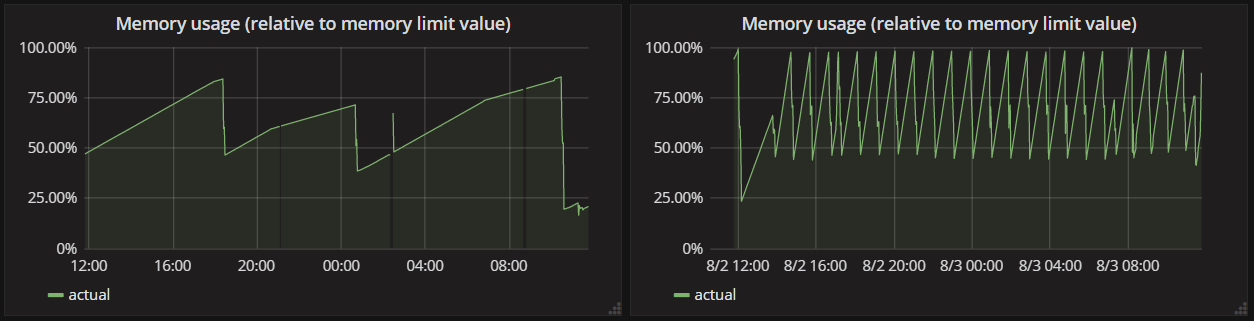
These graphs show the memory usage of two of our APIs, you can see that they keep increasing until they reach the memory limit, when Kubernetes restarts them.
We automatically thought that our APIs had memory leaks, and spent quite a lot of time investigating the issue, checking the allocations with Visual Studio, creating memory dumps, but couldn’t find anything.
We also tried various different ways to reproduce the problem in our development environment.
- in dev configuration in VS
- on Windows with a production build
- on Ubuntu with a production build
- in Docker, using the actual production image
But none of these environments produced the same high (>500MB) memory consumption, they increased until 100-150MB, and then stopped.
In the meantime, just to mitigate the continuous restarts of our containers we increased the memory limit from 500MB to 1000MB, which led to an interesting find. After increasing the limit, the memory usage of the containers looked like this.
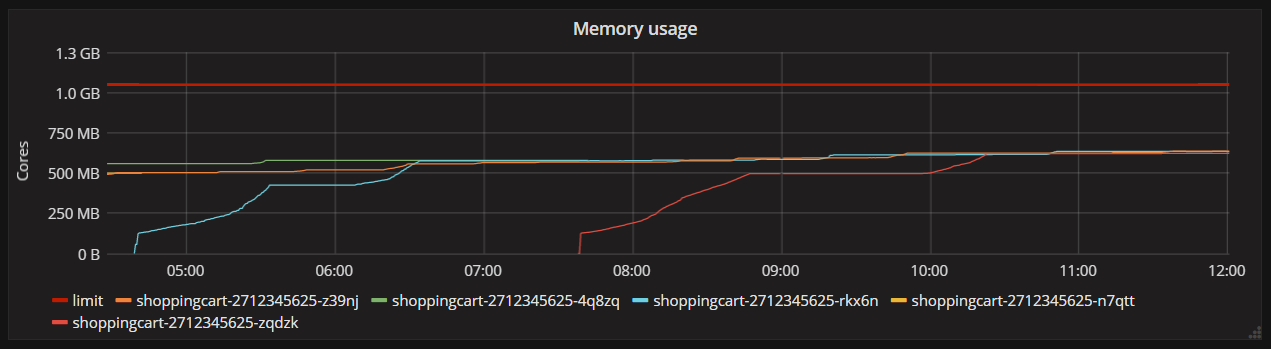
The memory usage didn’t increase infinitely any more (as I thought before), but it capped at around 600MB, and this number seemed to be pretty consistent between different container instances and restarts.
This was a pretty clear indication that we are not actually leaking, but simply a lot of memory is being allocated without any of it getting released. So I started looking into what .NET thinks its memory limit is when running in Kubernetes.
Kubernetes runs the applications in Docker images, and with Docker the container receives the memory limit through the --memory flag of the docker run command. So I was wondering that maybe Kubernetes is not passing in any memory limit, and the .NET process thinks that the machine has a lot of available memory.
This is not the case, we can find the contrary in the documentation.
The
spec.containers[].resources.limits.memoryis converted to an integer, and used as the value of the--memoryflag in the docker run command.
So this seemed to be another dead end. I also tried to run the API in Docker on my machine and pass in various limits in the --memory flag, but a) I couldn’t reproduce the ~600MB memory usage, it stayed at ~150MB and b) also didn’t observe the container running over its limit, even if I specified a lower value than 150MB, the container stayed exactly under the limit.
Earlier I also posted about this problem on Github under one of the memory leak issues related to Kestrel, and at this point, Tim Seaward sent an interesting suggestion about checking what’s the CPU Core count reported to my application on the various environments, since that can affect the memory usage a great deal.
I tried printing Environment.ProcessorCount on all environments, and I saw the following values.
- On my machine, just doing dotnet run, the value was
4. - On my machine, with Docker, it was
1. - On Google Cloud Kubernetes it was
8.
This can finally give an explanation, because the CPU count greatly affects the amount of memory .NET will use with Server GC, as it’s explained in the same issue by Ben Adams and Tim Seaward. The more CPU counts we have, the higher amount of memory we’ll end up using. (It’s still not 100% clear to me what’s the exact relationship between the type of GC, the number of cores, and the amount of memory a .NET application will hold on a given server, though this post contains some information.)
The suggestion was to switch from Server GC to Workstation GC, which optimizes for lower memory usage. The switch can be done by adding this flag to our csproj file.
  <PropertyGroup>
    <ServerGarbageCollection>false</ServerGarbageCollection>
  </PropertyGroup>
Doing this change and redeploying the API resulted in the following graph (the blue line shows the new deployment).
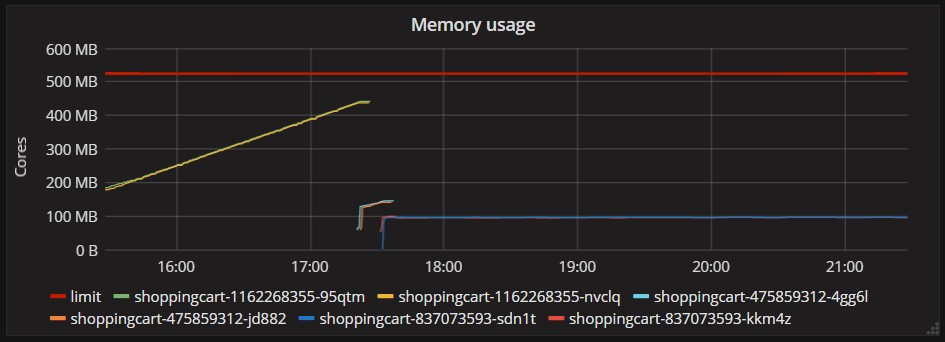
Workstation GC made the application be much more conservative in terms of memory usage, and decreased the average from ~600 MB to ~100-150MB. Supposedly Workstation GC can do this by sacrificing some of the performance and throughput that Server GC can provide, but so far I didn’t notice any degradation in speed or throughput, although this is not a particularly performance-critical API.
The important takeaway from this story is that the exact environment (OS, available memory, number of CPU cores) is crucial when troubleshooting memory issues because they can affect the .NET GC a great deal. And since there are many awesome folks in the .NET community happy to help, never hesitate to ask a question if you get stuck. ;)